As always, make a copy of the project you've already created. You also should have completed part 1, part 2, part 3, part 4, and part 5 to do this tutorial.
In this tutorial, we'll take a quick look at debugging using one of the SDK's command line utilities: palm-log. It's a little bit different than what we've done in previous tutorials since we'll be modifiying parts of the code to intentionally break our application or view log information.
To do this, open up your project folder that we've been working with throughout these tutorials. Now, let's modify first-assistant.js to comment out the { character on line 10: (Bold text is new)
function FirstAssistant() {
/* this is the creator function for your scene assistant object.
It will be passed all the
additional parameters (after the scene name) that were passed to
pushScene. The reference
to the scene controller (this.controller) has not be established
yet, so any initialization
that needs the scene controller should be done in the setup
function below. */
}
FirstAssistant.prototype.handleButtonPress = function(event)//{
// set a variable to the value of the textbox
this.amount=Number(this.amountModel.value); //This also converts
the text to a number
// increment the total and update the display
this.total = this.total + this.amount;
this.controller.get('count').update(this.total);
}
//The rest of the code isn't shown here -- Don't delete it, however!
//...
Let's examine what this code does:
If everything works, (or more accurately, doesn't work) then you should see something similar to the following when you start the application:
Oh no! The application no longer works -- Instead, it shows just the index.html content. So, let's see if the palm-log command can help us out. While the emulator is running, type palm-log followed by the id of your application. If you don't know the id, you can find this in the appinfo.json file. In my case, it's palm-log com.net-tech-group.addsubtractv6
Note that your results should something like this:
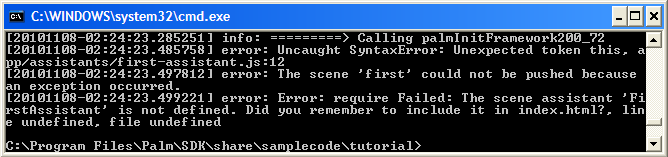
Note that the 2nd line of the results shows an error. (The first line simply indicates the start of your application.) Specifically, it complains that something unexpected is occurring at line 12. Wait, line 12? We removed the { from line 10, so why is line 12 reported as the problem? This is due to the fact that the WebOS doesn't realize there is a problem until line 12. It is expecting to see the { character, but when it gets to line 12, it sees that you're trying to set a variable. Since there isn't a { character before the variable is defined, it can't display this scene. (The next error in the results.)
So, even though it didn't exactly tell us everything that's wrong, it does at least give us an idea of what could be wrong and approximately where it might be happening. Unfortunately, that's one of the problems of troubleshooting: Error messages tell us symptoms, but don't always tell us the cause. You still have some detective work to do.
Fortunately, Ares has JSLint built-in that allows you to check JavaScript code. But, what if you're not using Ares? The good news is that you can add your application files to a .zip file and upload it to Ares for troubleshooting. (Note: You can run JSLint on its own, but I'm just going to show off Ares a little.) To so this, add your files to a compressed file. (In Windows, for example, select all your files and folders in the root of your app directory, right-click and choose Send to Compressed Folder.) Then, open up Ares in a non-IE browser, such as Firefox, by visiting https://ares.palm.com
Upload your .zip file by dragging it into the bottom left pane of the Ares application. Then, navigate to the first-assistant.js file in the application tree. Down in the bottom right of the Ares application, you should see, under the code, a toolbar with a JSLINT item. Click on the JSLINT item. Then, click the Check item. If that worked, you should see something similar to the following:
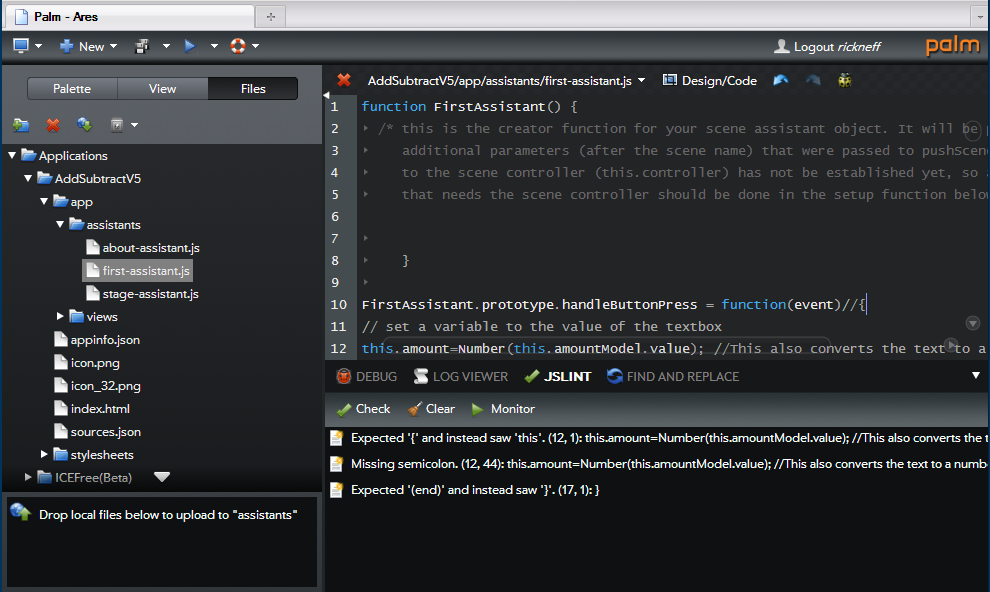
Once again, it shows an issue at (12,1) which means line 12, character 1. But, it gives a bit more info about what could be wrong. Instead of just stating that it expected something like palm-log did, it actually tells you what it was expecting: The { character. While I don't use Ares a lot myself, I do use it for to check my code via JSLint. Notice that it also has a Log Viewer, which is the same as the palm-log command. In fact, if you clicked on LOG VIEWER and ran your application, you should see the exact same stuff as palm-log earlier. (Note: The Log Viewer is also available as a stand-alone Web app. To use it, open your emulator, then open your non-IE browser and visit: http://ares.palm.com/AresLog/)
While palm-log provides some useful debugging info, the amount of information it can provide can be increased to show more detail. We can do this by creating a new file, framework_config.json to the root directory of our application. Simply create a text document and rename it to framework_config.json. Then, open the file and add the following:
This will allow you to see more items in the log to help with the debugging process. Why not try it with our Add/Subtract application? After you add this file and the code, package, install and run the application in the emulator. Show the log either in the command prompt or Ares Log. What's different in the log now that wasn't there before?
Important! Set the logLevel: back to 0 (zero) before releasing your applications.
Another useful feature of the log is that we can add to it ourselves. By using the Mogo.Log.info command we can write log information when the application runs. I use this to troubleshoot in 2 ways:Links to Palm's Developer Documentation:
Wow, lots of cool and, hopefully, useful troubleshooting information we covered in the article! If you have problems or still need help, I'd recommend asking in the following forums:
Back to Home